Fleet managers have a lot on their plates: Routes to optimize. Drivers to support. Maintenance to schedule. Budgets to defend. And somewhere underneath all of it, fuel, the largest line item for most fleet operations, moves through the business in ways that can be surprisingly hard to see in real time.
Fleet managers should have access to a complete picture of their fleet’s fueling – history, price, and use – not just when they need it for reporting, but on-demand, every day. That’s the gap Booster’s technical team has worked diligently to close.
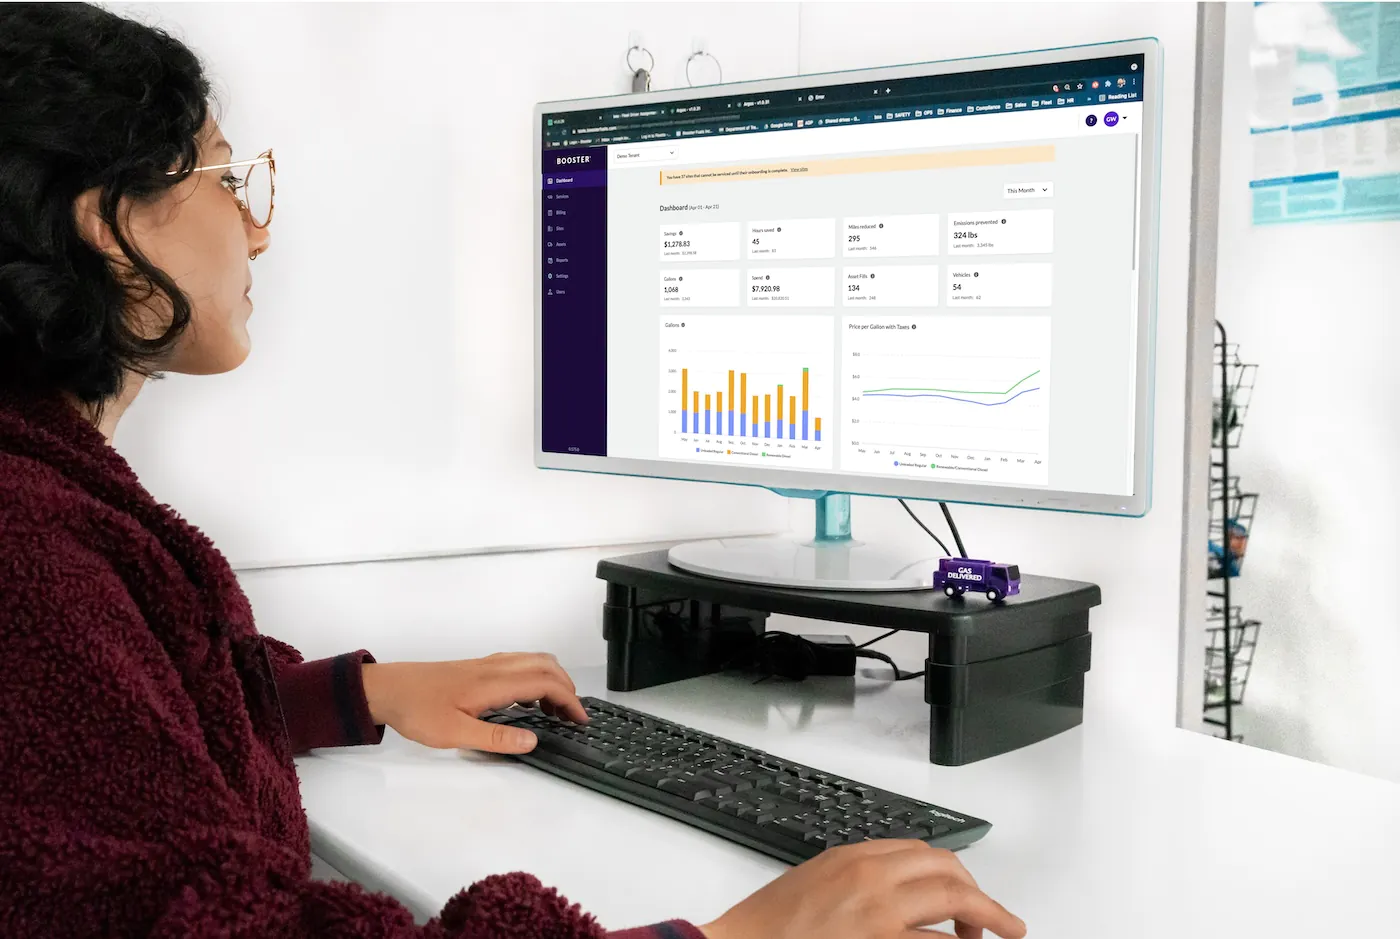
The same data that powers our internal fueling operations informs our customer dashboards – the same numbers, same view, available in real time. It pulls together delivery activity, fleet telematics, and fueling spend into one connected view. Instead of waiting on monthly invoices or chasing down information across three different systems, one login gives the team access to everything we know about a customer’s fleet – and everything fleet managers need to know for accurate reporting and budgeting.
Why Real-Time Fuel Data Matters for Fleet Managers
The cost of operating without real-time visibility tends to show up quietly, in places that are easy to miss until they add up, and suddenly budgets are in a deficit and leadership teams want to know how so many decimals could be missed.
A driver fills up at the wrong pump. A vehicle assigned to a low-utilization route burns through more gallons than expected. An invoice arrives a month after a discrepancy that nobody flagged because nobody saw it. These are small leaks, but small leaks become a serious problem when they multiply across a 50-truck fleet.
When fueling data is current and consolidated, those patterns surface while they’re still fixable. See fuel-per-vehicle trends as they emerge, spot unusual usage before it compounds, and tie fueling activity to the broader operational picture – routes, drivers, maintenance, location performance. That’s the difference between reacting to last quarter’s numbers and managing this week’s.
A 360° View of Your Fleet
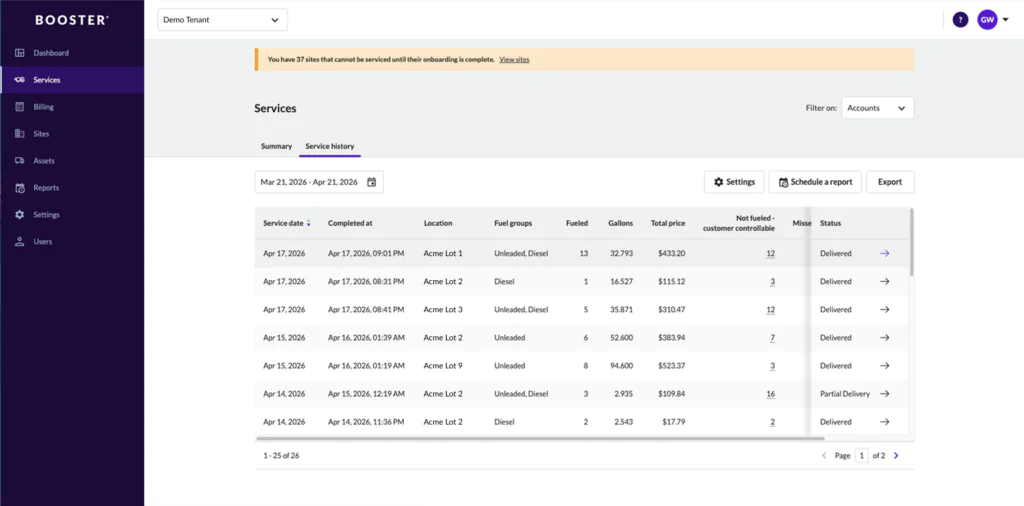
Booster’s customer dashboard consolidates the data points that fleet managers need to make timely decisions. Users can access a multitude of data from a single login:
- Total gallons fueled, total spend, and total vehicles serviced, by location, by week, or by month
- Vehicle-by-vehicle fuel usage, which is essential for fleets running clear diesel in off-road equipment and applying for the federal Off-Highway Business Use Fuel Tax Credit
- Driver and shift-level fueling activity, to verify that what was delivered matches what was needed
- Labor hours saved, miles reduced, and emissions prevented – the operational ROI of switching to fuel delivery over traditional service stations
- Booster’s fixed service fees and per-gallon pricing, displayed transparently so there are no end-of-month surprises
The point isn’t to drown a fleet manager in numbers. It’s to provide the right numbers, in context, and on demand.
Integrations That Build the Full Picture
Fueling data is most useful when it lives next to the rest of a team’s operational data. That’s why Booster’s dashboard is built around integrations with the industry-leading platforms most teams are already using.
On the telematics side, we connect with Geotab, Samsara, and Verizon Connect so fueling activity sits alongside the route, idling, and driver-behavior data those systems already track. On the fuel card and spend side, we integrate with WEX, Voyager, and Comdata to bring purchase activity into the same view, making it dramatically easier to identify suspicious transactions or patterns that point to fuel card misuse. And for fleets working with major fleet management companies like Enterprise Holdings and ARI, now known as Holman, we connect there too, so insights aren’t fragmented across separate logins.
The result is a single unified picture of a fleet’s fueling reality brought together in one place.
Beyond the Numbers: Tools That Save Time
Real-time visibility is the foundation, but the dashboard does more than display data.
Finance management lives inside the platform. Billing history, invoice settlement, and spend thresholds are all accessible without bouncing between tools. Booster’s fixed service fees and per-gallon pricing are displayed openly, line by line, so there are no end-of-month surprises. For administrative teams that have historically spent significant hours each month reconciling fuel card activity, that openness alone can return real time back to the business.
Customizable analytics reports can be scheduled to land in an inbox weekly, monthly, or quarterly, filtered and sorted to surface exactly the data that’s needed for internal reporting or compliance work around emissions.
Want a per-location fuel spend report on the first of every month? Done.
Need a quarterly emissions summary for the sustainability team? Ready at the touch of a button.
Useful data shouldn’t sit locked in a system only Booster can see.
Customer support is built in for the same reason. Submit feedback directly through the portal, get product update alerts, and receive maintenance notifications so that nothing important can be missed. Transparency isn’t a feature we layered onto the dashboard. It’s the principle the dashboard was built on.
Move From Guessing to Knowing
By providing a clear picture of what fleet managers are actually spending and what their trucks are actually using, our real time data dashboards help our customers immediately see more about their fleet operations. Within 30 days, many of our customers are surprised as that visibly adds up to real savings. Longtime Booster customers at Ferguson rely on this transparency: “The website is easy to use and gives us a great breakdown of our fueling costs, savings, and specific service details. The data we are provided allows us to better understand our fuel costs all in one place.”
When fuel markets are stable and budgets are loose, fleet managers sometimes try to survive by managing fueling on instinct. And when markets are volatile and every gallon matters, real-time data is the difference between staying ahead of cost pressures and being surprised by them.
If your team is still piecing together fueling information from multiple systems, monthly invoices, and best guesses, we’d love to show you what one connected view looks like instead. Reach out to talk to a member of our team, and we’ll walk you through the dashboard with your own fleet’s data.